An official website of the United States government
Here’s how you know
Official websites use .gov
A .gov website belongs to an official government organization in the United States.
Secure .gov websites use HTTPS
A lock (
) or https:// means you’ve safely connected to the .gov website. Share sensitive information only on official, secure websites.
-
//
- Census.gov /
- Library /
- Publications /
- 90+ in the United States: 2006-2008
90+ in the United States: 2006-2008
90+ in the United States: 2006-2008
Introduction
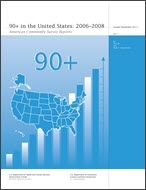
An increasingly important feature of population aging in the United States is that the older population itself is getting older.1 That is, the proportion of the population aged 90 and over among the older population has been increasing. Thanks to increases in life expectancy at older ages, the oldest segments of the older population are growing the fastest. A nation’s oldest-old population consumes resources disproportionately to its overall population size, and its growth has a significant impact on societal and family resources, including pension and retirement income, health care costs, and intergenerational relationships (Kinsella and He, 2009; Zhou, Norton, and Stearns, 2003).
This report presents an overview of the population aged 90 and over in the United States and a comparative analysis of selected characteristics between the 90-and-older and other older age groups. Data for this report primarily come from the 2006–2008 and 2008 American Community Surveys (ACS). Because the 2006–2008 ACS 3-year estimates are based on a larger sample than 1-year estimates and therefore are more reliable, they are used for analysis of the 90-and-over population by age, sex, race, and Hispanic origin at the national level and by age and sex at the state level.2
The 2008 ACS 1-year estimates in this report supplement the 3-year data at the national level with information from the changed questions on disability and the newly added question on health insurance coverage.3
__________
1 In this report, “older population” refers to people aged 65 and over.
2 Multiyear estimates should, in general, be used when single-year estimates have large coefficients of variation or when the precision of the estimates is more important than the currency of the data. Multiyear estimates should also be used when analyzing data for smaller geographies and smaller populations in larger geographies. Multiyear estimates are also of value when examining change over nonoverlapping time periods and for smoothing data trends over time.
3 The single-year and 3-year ACS estimates are period estimates that represent data collected over a period of time. The 2008 estimates used in this report were collected over a 12-month period in 2008 and the 2006–2008 estimates used in this report were collected over a 36-month period during 2006 to 2008. For more information on the methodology of the ACS, see text box “What Is the American Community Survey (ACS)?”
Others in Series
Publication
Publication
Publication
Share
Related Information
Some content on this site is available in several different electronic formats. Some of the files may require a plug-in or additional software to view.
 Yes
Yes
 No
NoComments or suggestions?


Top

