
Median Household Income in 2025 Surpassed Previous Highs Before and After the COVID-19 Pandemic
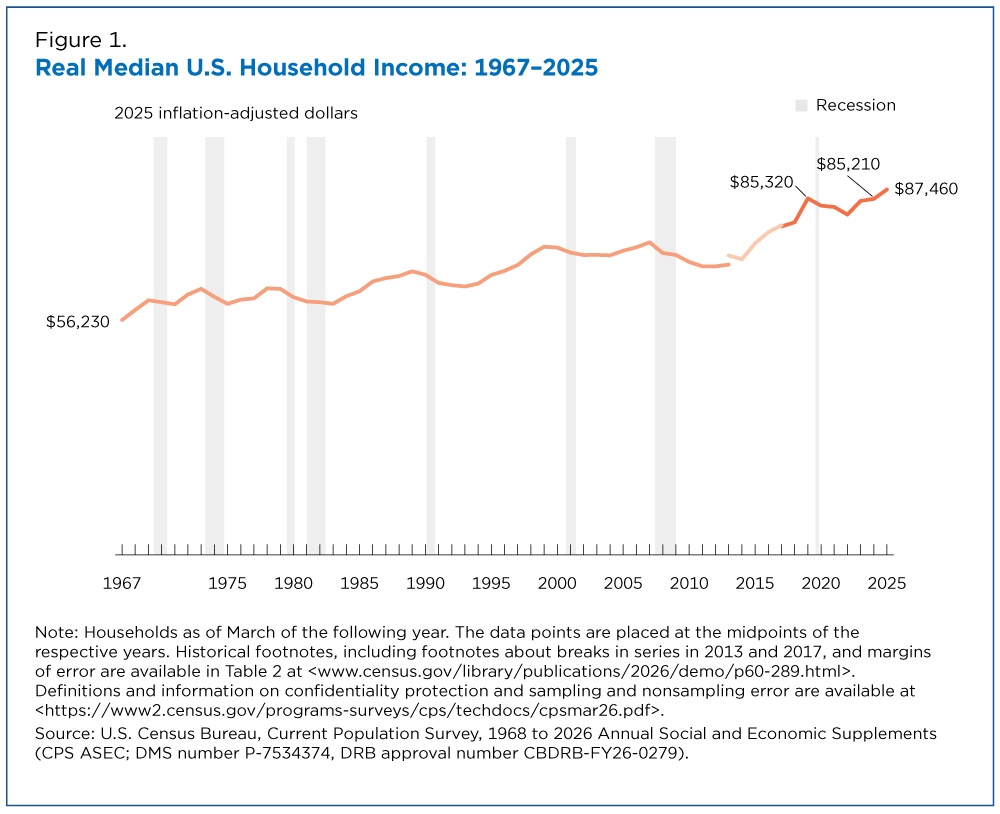
U.S. real median household income was $87,460 in 2025, up 2.6% from the previous year and the highest on record since 1967 when the U.S. Census Bureau began tracking this measure, according to a new report released today.
Median household income is the midpoint where half of households have higher income, and half have lower income. All estimates here are adjusted for inflation.
Historic High
The median household income estimate of $85,210 for 2024 was not statistically different from the estimate in 2019, the last year prior to the COVID-19 pandemic and the record high to that point.
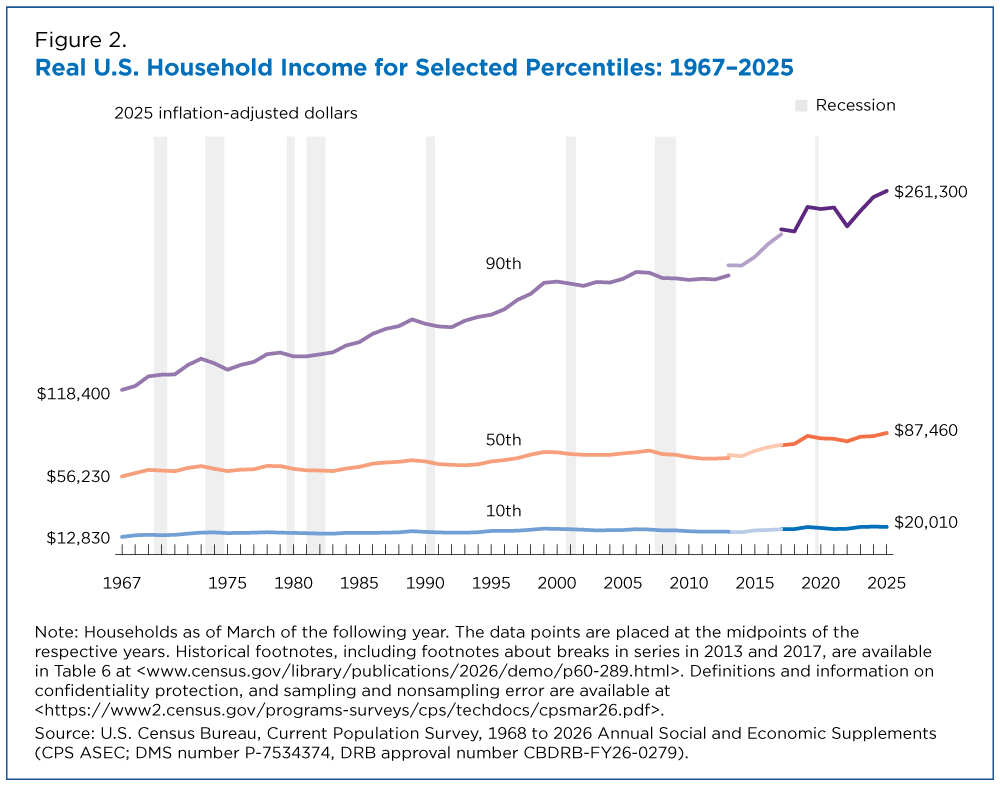
At the top of the income distribution, this was the third consecutive year-over-year increase in both pre- and post-tax income at the 90th percentile.
According to the Census Bureau’s Income in the United States: 2025, the median household income in 2025 of $87,460 (±$1,040) was higher than in both 2019 and 2024 (Figure 1).
Post-Tax Income
The Census Bureau also produces income estimates after accounting for taxes and credits.
Post-tax median household income was $76,060 (±$712) in 2025, up 3.1% from $73,760 in 2024 but not a record high.
It did not surpass 2020 or 2021, when households received stimulus payments and other credits in response to the COVID-19 pandemic.
Other Measures
Median income is just one way to gauge household well-being and the health of the American economy. Each year, the Census Bureau releases many other estimates related to income inequality and well-being at different points of the income distribution.
At the top of the income distribution, this was the third consecutive year-over-year increase in both pre- and post-tax income at the 90th percentile.
But at the bottom of the income distribution, pre- and post-tax income at the 10th percentile in 2025 did not differ significantly from 2024.
From 1967 to 2025, pre-tax household income at the 10th and 50th percentiles increased by about 56%. By contrast, it rose by about 121% at the 90th percentile, or the top of the income distribution (Figure 2).
The ratio of the 90th percentile to the 10th percentile widened from 9.23 in 1967 to 13.06 in 2025. This means that in 2025, households at the 90th percentile had income 13 times greater than those at the 10th percentile, reflecting a growing gap between the top and bottom of the income distribution over time.
Margins of error are not available for 10th and 90th percentile estimates in 1967 and therefore comparisons involving those estimates are not tested for statistical significance.
The Current Population Survey Annual Social and Economic Supplement (CPS ASEC) technical documentation includes information on confidentiality protection, methodology, and sampling and nonsampling error. All comparative statements have undergone statistical testing and are statistically significant at the 90% confidence level unless otherwise noted.
Related Statistics
Subscribe
Our email newsletter is sent out on the day we publish a story. Get an alert directly in your inbox to read, share and blog about our newest stories.
Contact our Public Information Office for media inquiries or interviews.
Related America Counts Stories
-
Health InsuranceMedicaid Coverage Declined in 2025 for Second Year in a RowSeptember 15, 2026Changes in policy, funding, eligibility and enrollment processes that began in 2020 contributed to decline in Medicaid coverage.
-
Income and PovertyHispanic Poverty Rate Reached Historic Low in 2025September 15, 2026The Hispanic population’s poverty rate fell to 13.9%, down 1.2 percentage points from 2024 — still disproportionately high despite being the lowest on record.
-
Income and PovertySupplemental Poverty Rate Tops Official Rate in 26 States, DCSeptember 15, 2026Louisiana had among the nation’s highest poverty rates by both the official poverty measure and the Supplemental Poverty Measure.
-
EducationBeyond Diplomas: Nondegree Credentials Linked to Higher EarningsSeptember 22, 2026High school graduates and even those with college degrees earned more with nondegree credentials targeting specific work skills.
-
Emergency PreparednessCalm Atlantic Hurricane Season Could Mean Active One in the PacificSeptember 17, 2026Census Bureau data tools can help communities prepare for and recover from hurricanes and other disasters wherever they are.
-
Income and PovertyHispanic Poverty Rate Reached Historic Low in 2025September 15, 2026The Hispanic population’s poverty rate fell to 13.9%, down 1.2 percentage points from 2024 — still disproportionately high despite being the lowest on record.
-
Health InsuranceMedicaid Coverage Declined in 2025 for Second Year in a RowSeptember 15, 2026Changes in policy, funding, eligibility and enrollment processes that began in 2020 contributed to decline in Medicaid coverage.