
Official websites use .gov
A .gov website belongs to an official government organization in the United States.
Secure .gov websites use HTTPS
A lock (
) or https:// means you’ve safely connected to the .gov website. Share sensitive information only on official, secure websites.

Topics
Data & Maps
Surveys & Programs
Resource Library
Stats for Stories: *Special Edition* Fires in Southern California
Press Release Number CB17-SFS.116
Governor’s Office of Emergency Services: Incident Overview — “The first of the southern California wildfires broke out on the evening of December 4, and fires continue to burn in numerous counties while ongoing dangerous weather conditions continue. Thus far, thousands of acres have burned destroying infrastructure, residences, and prompting mass evacuations. The fires have closed several major highways, cancelled schools, and have threatened historical landmarks.”
Cal Fire, Incident Information: Thomas Fire — As of December 19, 2017, 9:31 a.m., 271,750 acres burned — 50 percent contained, 18,000 structures threatened, 1,024 structures destroyed, 250 structures damaged, 8,094 total fire personnel, 876 total fire engines, 161 total fire crews, 35 total helicopters, 72 total dozers and 58 total water tenders.
California residents are urged to be prepared for wildfires now. Learn more by visiting www.ReadyForWildfire.org.
Using U.S. Census Bureau Data for Emergency Response and Recovery
The Census Bureau has publicly available statistics and free tools, including:
American Community Survey: The only reliable and timely source of comprehensive social, economic, housing and demographic characteristics of the U.S. population at the community level.
data.census.gov: A detailed data tool that allows you to access over 11 billion statistics from the American Community Survey every year on topics such as language, disability status, vehicle availability and much more.
Census Business Builder: Regional Analyst Edition — 2.3: A new tool that allows FEMA and other emergency management professionals to quickly view a detailed portrait of the people and businesses in a user-defined region. For example, the report on Thomas Fire/Ventura County, California is located here.
OnTheMap for Emergency Management: An intuitive, web-based data tool that provides real-time access to a range of detailed U.S. Census Bureau data about the people living and working in areas being affected by hurricanes, floods, wildfires, winter storms and federal disaster declaration areas.
Key Stats:
OnTheMap for Emergency Management provides real-time access to a range of detailed Census Bureau data about the people living and working in federal disaster declaration areas and areas being affected by hurricanes, floods, wildfires and winter storms. <br ></br> Sources: 2010 Decennial Census data, 2011-2015 American Community Survey 5-year estimates and 2014 Longitudinal Employer-Household Dynamics Origin-Destination Employment Statistics.

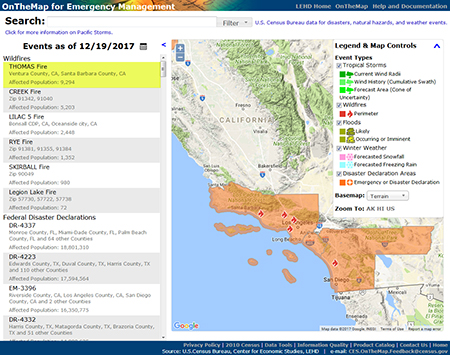
Note: The map above is zoomed in to southern California to show all wildfires and affected areas. Wildfires are listed by affected population from greatest to least. Click on the image to view the full page, then click on any fire to see detailed characteristics and other stats.
More Stats:
From Census.gov > Emergency Preparedness:
Source: QuickFacts — Statistics for all states and counties, and for cities and towns with a population of 5,000 or more.<br /><br /> QuickFacts data are derived from the Census Bureau’s Population Estimates, American Community Survey, Census of Population and Housing, Current Population Survey, Small Area Health Insurance Estimates, Small Area Income and Poverty Estimates, State and County Housing Unit Estimates, County Business Patterns, Nonemployer Statistics, Economic Census, Survey of Business Owners and building permits.
Source: Newsroom
Source: 2016 Annual Survey of Public Employment & Payroll.

Related Info:

Page Last Revised - December 16, 2021
✕
Is this page helpful?
 Yes
Yes
 No
No
 Yes
Yes
 No
No✕
NO THANKS
255 characters maximum
 255 characters maximum reached
✕
Thank you for your feedback.
Comments or suggestions?

Comments or suggestions?